Developed Work and Current State (II)
Analysis of multichannel sEMG
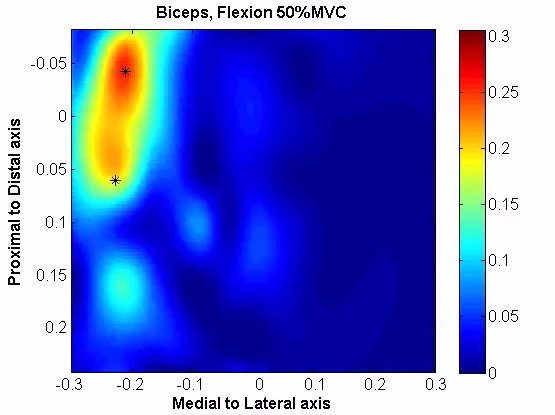
The classical EMG parameters were estimated from the signals on the available EMG databases: Average Rectified Value (ARV), Root Mean Square (RMS), Mean and Median frequencies (MNF, MDF) and Conduction Velocity of the Motor Unit Action Potentials (CV).
Additionally, average intensity maps (calculated from the RMS or the ARV of individual channels) were obtained for the HDEMG database.
This video (download mp4 ) displays the activation of the Biceps during an isometric flexion at 50% of the Maximum Voluntary Contraction. The activation map was obtained from an HDEMG signal recorded with a 2D array consisting in 15 columns of electrodes in the x-axis (medial to lateral) by 8 rows of electrodes in the y-axis (distal to proximal). The interelectrode distance was set to 10 mm in each axis. In the video, the intensity map corresponds to the instant absolute value of the signals for a total duration of 150ms. For visualization purposes, the instant values were interpolated to obtain 188 and 100 points in the x and y dimension respectively. The propagation of some Motor Unit Action Potentials is pointed with a star (*). It is possible to observe the Innervation Zones (the areas where the potentials are originated) and the propagation not only along the y-axis but also in other directions not perpendicular to the axes.
The activation areas (corresponding to the areas of brightest intensity) were segmented from the global maps before its parameterization in terms of its spatial distribution of the intensity (centers of gravity, coordinates of maximum values) and mean and maximum values of intensity. This parameterization allowed the differentiation between exercise kinds and contraction levels in the control group based only on EMG signals.
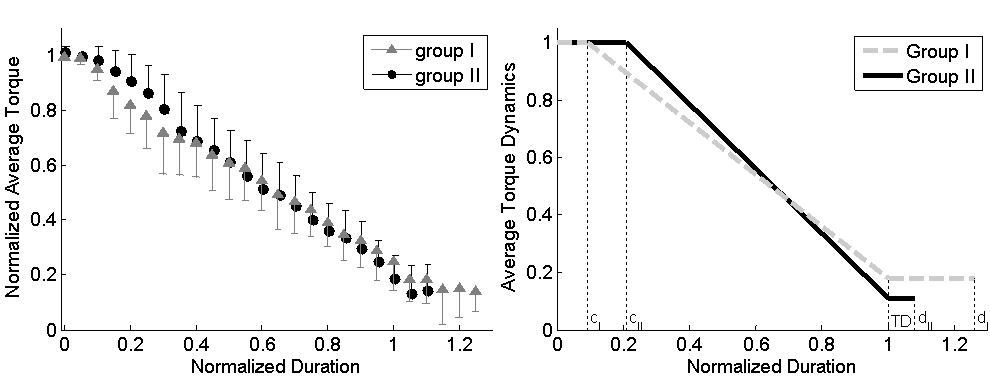
Finally, the torque developed during dynamic contractions was analyzed in controls and patients with lateral epicondylitis (LE). Muscular imbalances and higher predisposition to mechanical fatigue were found in patients with LE even after treatment and reincorporation to work activities.
Share: